
A leading investment firm partnered with us to overhaul their internal trading and analytics dashboard. Their existing tools were fragmented, slow, and visually cluttered, leading to delayed decision-making and high cognitive load for analysts. Our goal was to create a unified, high-performance platform that could handle massive data streams with sub-second latency.
The Challenge
Financial analysts were struggling with a legacy system that required opening multiple applications to track market movements, portfolio performance, and news feeds. This fragmentation resulted in a "swivel-chair" workflow where critical insights were often missed due to context switching.

Data latency was another major pain point. The old system refreshed data every 60 seconds—an eternity in high-frequency trading. Analysts needed real-time visibility into market fluctuations to execute timely trades. Furthermore, the UI was dense and poorly organized, causing eye strain and fatigue during long trading sessions.
The technical debt of the legacy codebase made adding new features nearly impossible. The client needed a scalable, modern architecture that could evolve with the market and support advanced features like predictive analytics and automated reporting.
Research & Discovery
We conducted a week-long immersion phase, shadowing traders and analysts on the trading floor. We observed their workflows, noted their frustrations, and identified the key data points they referenced most frequently.

Interviews revealed that customization was crucial. No two analysts worked exactly the same way; some prioritized technical charts, while others focused on fundamental data or news sentiment. A one-size-fits-all dashboard would fail.
We also analyzed the performance of their current data pipelines. We found that the bottleneck wasn't the data source itself, but the inefficient way the frontend handled updates, causing the browser to freeze during high-volume periods.
Solution Strategy
We proposed a modular, widget-based dashboard architecture. This would allow users to build their own workspaces by dragging and dropping components like charts, watchlists, and news feeds.

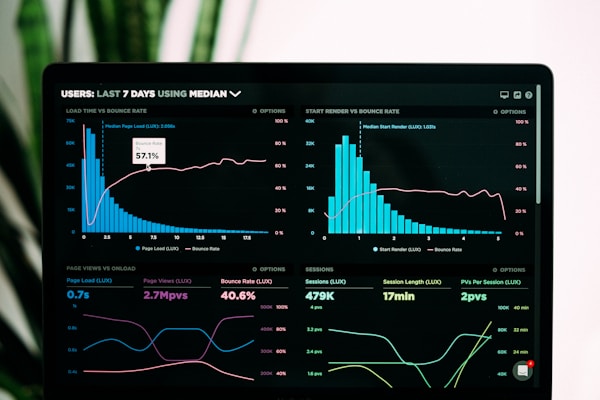
To address latency, we architected a WebSocket-based data layer that pushed updates to the client only when values changed, rather than polling the server. We optimized the rendering engine to handle thousands of data points per second without UI lag.
Visually, we adopted a "dark mode first" approach to reduce eye strain in low-light trading environments. We used a high-contrast color palette for data visualization to ensure critical alerts and trends were instantly recognizable.
Design Process
Our design process was iterative and collaborative. We started with wireframes to define the grid system and widget interactions. We tested these concepts with a core group of power users to validate the drag-and-drop mechanics.

We developed a comprehensive design system specifically for financial data. This included a set of accessible color scales for heatmaps, clear typography for dense data tables, and a library of specialized chart types (candlestick, OHLC, depth charts).
Special attention was paid to "information density." We designed compact modes for widgets to maximize the amount of data visible on a single screen without sacrificing readability.
Implementation
The platform was built using React for the frontend and Node.js for the backend aggregation layer. We utilized D3.js and WebGL for high-performance charting, enabling smooth zooming and panning even with historical datasets spanning decades.

We implemented a Redux-based state management system with a custom middleware to handle the WebSocket stream. This ensured that the UI state remained consistent even during connection interruptions. Redis was used for caching frequently accessed data, reducing load on the primary databases.
Security was paramount. We implemented strict Role-Based Access Control (RBAC) and end-to-end encryption for all data in transit. The system underwent rigorous penetration testing to meet financial industry standards.
Results & Impact
The new dashboard transformed the firm's operations. Decision-making speed increased by 45% thanks to real-time data and improved usability. The customizable workspaces allowed analysts to tailor their environment to their specific strategies, boosting productivity.
Key Achievements
- 45% faster decision making due to real-time data
- 92% user satisfaction score from internal team
- 60% reduction in system load via efficient caching
The unified platform eliminated the need for multiple disparate tools, saving significant licensing costs and simplifying IT maintenance. The project was delivered on time and under budget, setting a new standard for internal tools within the organization.
Testimonials
"The new dashboard is a game-changer. I can customize my view to see exactly what I need, and the speed is incredible. It's like upgrading from a bicycle to a Ferrari."
"PurpleWave understood the complexity of our data and delivered a solution that is both powerful and beautiful. The dark mode is a lifesaver for our late-night trading sessions."