
A fast-growing B2B SaaS platform was facing a critical retention problem. While their marketing team was successfully driving sign-ups, 60% of new users abandoned the platform within the first week. We were brought in to reimagine the onboarding experience, helping users discover value faster and reducing early-stage churn.
The Challenge
The platform was powerful but complex. New users were dropped into a blank dashboard with no guidance, leading to "blank slate paralysis." They struggled to understand where to start or how to configure the tool for their specific needs.
Data analysis showed that users who didn't complete the initial setup within 3 days were 80% likely to churn. The existing "onboarding" consisted of a long, generic email sequence and a link to a 50-page documentation wiki.
The client needed a solution that would hand-hold users through the "Aha!" moment—the point where they realized the tool's value—without being intrusive or annoying.
Research & Discovery
We started by analyzing the behavior of the "power users"—the top 10% of customers who were getting the most value from the platform. We identified the key actions they took in their first week that correlated with long-term retention.


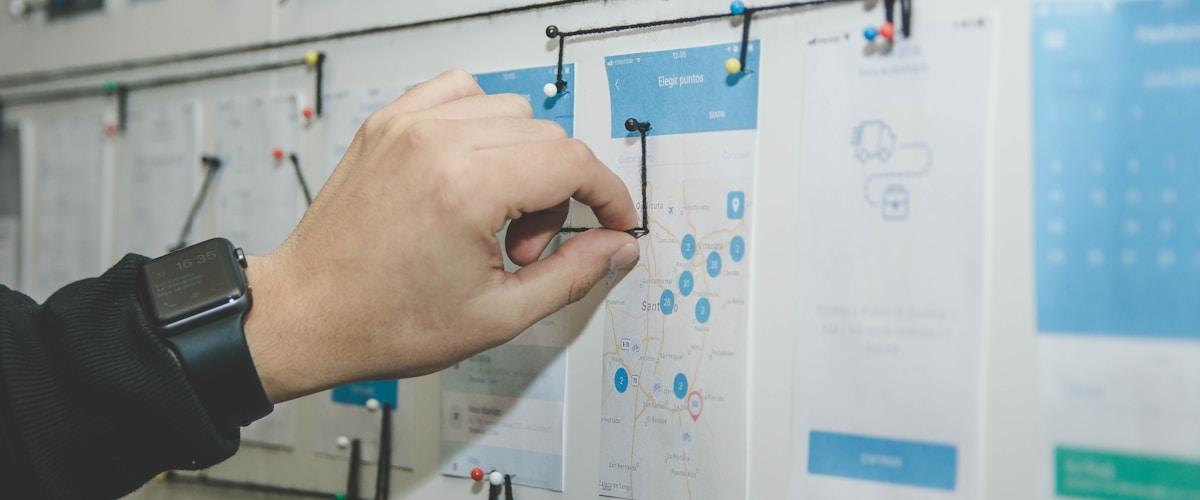
We also conducted usability tests with new sign-ups, observing their frustration as they tried to navigate the interface. A common theme was "I don't know what I don't know." They wanted a guided tour, not a map.
Competitor analysis revealed that industry leaders were using interactive checklists and personalization to tailor the experience. This confirmed our hypothesis that a "one-size-fits-all" approach was failing.
Solution Strategy
We designed a "Choose Your Own Adventure" onboarding flow. Upon sign-up, users were asked 3 simple questions about their role and goals. Based on their answers, the platform would dynamically generate a personalized setup checklist.

We replaced the empty state dashboard with a "Getting Started" widget that tracked progress. Completing tasks (e.g., "Invite a teammate," "Create your first project") was gamified with progress bars and celebratory animations.
Crucially, we introduced interactive tooltips that highlighted key features in context, rather than forcing users to read external documentation.
Design Process
We focused on "frictionless friction." We added steps to the sign-up flow (the personalization questions), which technically added friction, but actually increased motivation by showing users that the product was tailored to them.


The visual design used the "Zeigarnik Effect"—the psychological principle that people remember uncompleted tasks better than completed ones. We showed a progress bar that was already 20% full (for creating an account) to encourage users to finish the rest.
We designed empty states that weren't empty. Instead of "No projects found," we showed a friendly illustration and a big "Create Project" button with a one-sentence explanation of why they should.
Implementation
We built the onboarding layer using React and a state machine to manage the complex logic of the guided tour. This allowed us to handle edge cases (e.g., user leaves and comes back) gracefully.

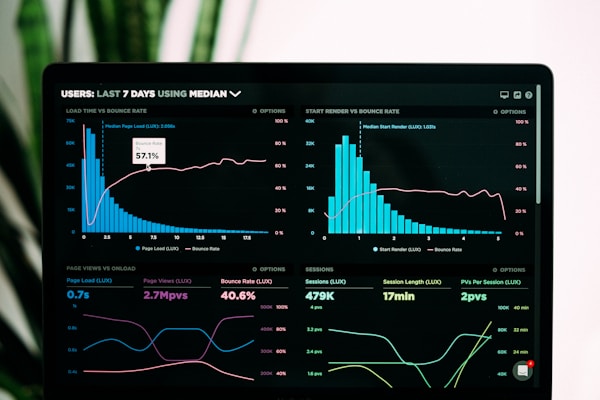
We integrated with Segment and Mixpanel to track every step of the funnel. This granular analytics setup allowed us to see exactly where users were dropping off and iterate on the copy and design in real-time.
Email triggers were synchronized with in-app behavior. If a user stalled on step 3, they received a helpful tip via email related specifically to that step, rather than a generic "Come back!" message.
Results & Impact
The impact was immediate. The "Time to First Value" (TTFV) decreased from 4 days to 45 minutes. Users were getting set up and seeing results in their first session.
Key Achievements
- 40% reduction in Week 1 churn
- 85% onboarding completion rate (up from 35%)
- 25% increase in trial-to-paid conversion
By helping users find success early, we created a cohort of "sticky" users who were more likely to upgrade to premium plans and refer colleagues. The onboarding flow became a key competitive advantage.
Testimonials
"We were losing users faster than we could acquire them. PurpleWave's onboarding redesign plugged the leaky bucket. Our retention numbers have never looked better."
"I usually skip onboarding tours, but this one was actually helpful. It asked me what I wanted to do and then showed me exactly how to do it."